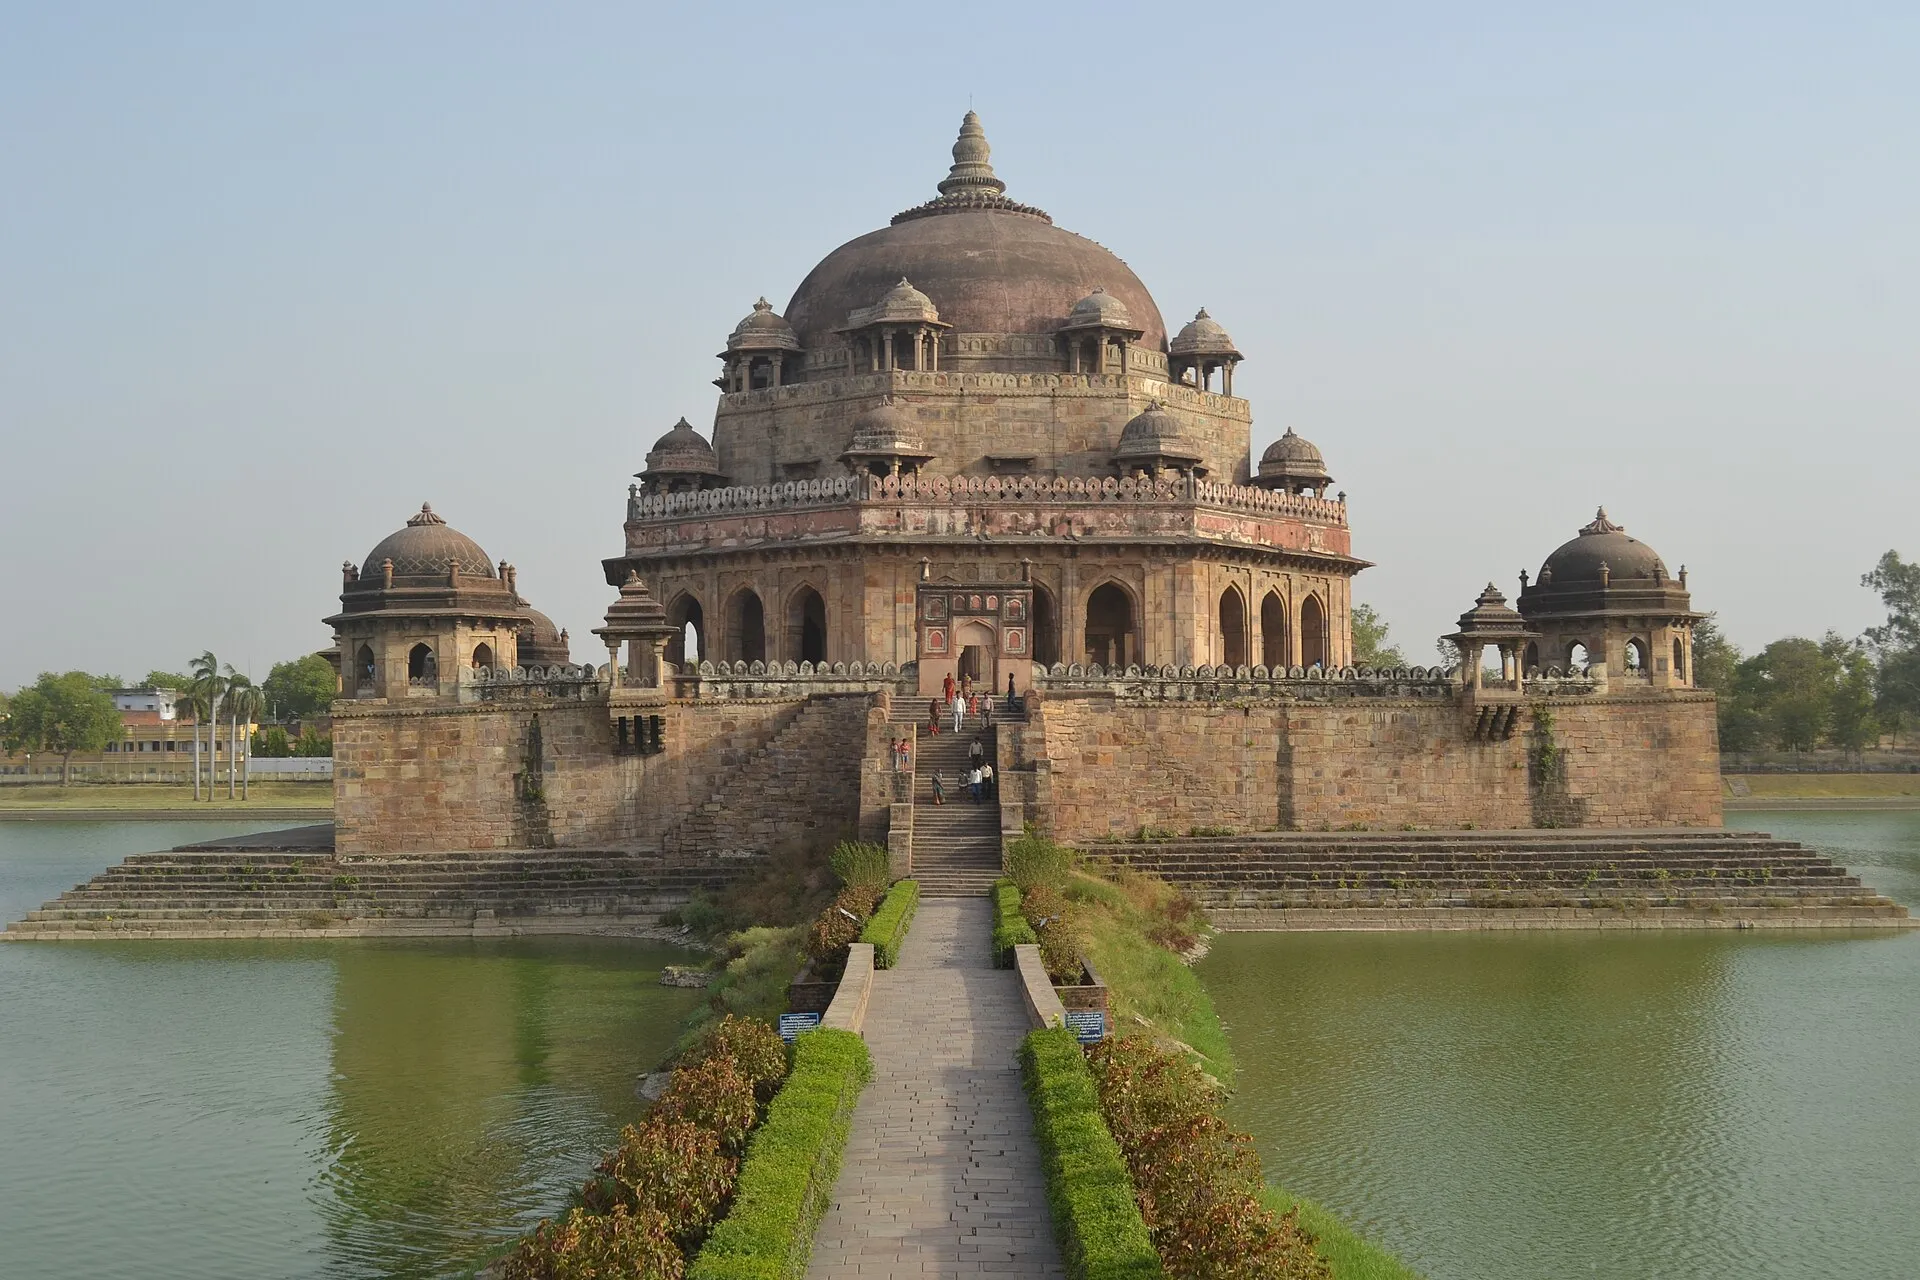

Sher Shah Suri's tomb
A causeway crosses the water to the tomb. In this 2012 photograph, the approach, the central dome and the smaller domed pavilions can be read together. The setting is Sasaram, in Rohtas district.
Read the place recordDistrict factbook / BU-29
Bihar · LGD 215
Estimated population of Rohtas. Rank 18 of 38 in this projection.
1.08% annual pace implied by the model’s 2021–2026 values. This is not measured annual growth.
The source projects 35,64,829 people for 1 March 2026. It uses a district ratio method with Government of India state projection inputs. This is a published estimate, not a new Census enumeration or a live count.
The 2011 Census counted 29,59,918 people here. Literacy, density, rural/urban shares and sex ratio below still refer to 2011; they have not been relabelled 2026.
Annual model pace = ((2026 projection ÷ 2021 projection)^(1/5) − 1) × 100. Displayed lakh values are rounded; calculations use source integers.
Read this district’s original projection table ↗CENSUS / 2011
People counted in Rohtas district.
Rank 17 of 38 by population in this source.
The population is a 2011 Census count, not a present-day projection. Literacy is republished to one decimal. Density is the source’s 2011 figure; it is not calculated using the later map.
| Category | Rate |
|---|---|
| Total | 73.4% |
| Male | 82.9% |
| Female | 63% |
Census literacy refers to the population aged seven and above. The total rate is the source’s published rate, not a simple average of male and female rates. Sex ratio comes from the separate Census-labelled DES chart series.
Source value: ₹25,29,874 lakh.
2023–24 · rupees per person
Per-capita income is not GDP per person or a household’s earnings. These are current-price figures for 2023–24. They have not been adjusted for inflation or carried forward to 2026.
A PMFME programme designation. It does not mean this is the district’s only product, largest crop, or a geographical indication.
| Crop | Production (tonnes) |
|---|---|
| Rice | 10,60,797 |
| Wheat | 7,50,869 |
| Maize | 3,720 |
| All cereals (includes the rows above) | 18,15,386 |
Rice, wheat and maize are components of the cereals total. Do not add the total to those components. The endpoint’s separate “food grain” field is excluded because its period and definition could not be reconciled.
Rainfall and temperature have different reference periods and geographic methods. They are shown separately.
0–400 mm · zero baseline
| Month | Normal (mm) |
|---|---|
| Jan | 12.2 |
| Feb | 14.2 |
| Mar | 7.6 |
| Apr | 5.9 |
| May | 15.1 |
| Jun | 105.1 |
| Jul | 310.7 |
| Aug | 263.4 |
| Sep | 209.8 |
| Oct | 36.7 |
| Nov | 7.5 |
| Dec | 6.2 |
Historical station-based district normals, using available records within 1951–2000. The publication’s district geography is not asserted to match the 2021 map. This is not a current rainfall forecast.
0–40 °C · monthly mean temperature at 2 metres
| Month | Mean | Model max. | Model min. |
|---|---|---|---|
| Jan | 16.18 | 33.14 | 2.65 |
| Feb | 20.44 | 38.59 | 4.85 |
| Mar | 26.36 | 43.06 | 8.75 |
| Apr | 32.34 | 46.42 | 16.66 |
| May | 35.4 | 47.64 | 20.93 |
| Jun | 34.6 | 48.04 | 23.75 |
| Jul | 30 | 41.07 | 24.28 |
| Aug | 28.59 | 38.25 | 23.61 |
| Sep | 27.51 | 37.46 | 19.56 |
| Oct | 25.19 | 36.58 | 12.33 |
| Nov | 20.89 | 33.49 | 8.51 |
| Dec | 16.92 | 32.38 | 1.84 |
Sampling point 24.93963° N, 83.98222° E, chosen on the source polygon. Grid: MERRA-2 native meteorology grid: 0.5° latitude × 0.625° longitude. Seasonal means use equal month weights. Summer model maximum: 47.64 °C. Winter model minimum: 1.84 °C. These extrema are reanalysis model values for the period, not observed station records.
Inspect the exact NASA response ↗A coarse grid-cell sample, not a district average. We requested 2001–2020 explicitly and checked each response period; the API’s default uses a different period.
A causeway crosses the water to the tomb. In this 2012 photograph, the approach, the central dome and the smaller domed pavilions can be read together. The setting is Sasaram, in Rohtas district.
Read the place record5 entries in the 31 July 2023 district table.
Ministry of Culture · parliamentary reply 31 Jul 2023That table totals 70 sites for Bihar. A newer March 2026 reply reports 71 statewide, without a district crosswalk. We keep the dated district figures instead of labelling them current.
Undated source list; district names retained as printed and may be historical. These names are not a present-day geographical reassignment. NMA source & limitations.
Son
Natural Earth 1:10m datasetNames reflect a geometric intersection of two approximate map datasets. This is not a complete river inventory; absence here does not mean absence of rivers. “Ganges”, “Ghäghara” and “Sapt” are the source’s labels.
Map-derived area is not the official Census area and is not used as the denominator for population density. The span is not a road distance. Geographic methods.
This page combines a 2011 demographic snapshot, 2023–24 income, 2024–25 crop output, a 2024 product list and separate historical climate series. It does not describe one common year.
Male/female population counts, workforce and religion are not available in this edition. Rounded sex ratios are not used to reconstruct counts.
Sources retrieved 25 October 2026. Bihar Unpacked is independent; source attribution does not imply government endorsement. Reuse terms differ between layers.